Architecture
Monitoring-as-Code is a Prometheus/Grafana based framework only. We are not responsible for the Prometheus and Grafana monitoring and alerting infrastructure which support the artefacts generated by MaC. (Although we do provide a local docker-compose setup which simulates a highly available Prometheus/Grafana environment.)
Architecture Diagrams
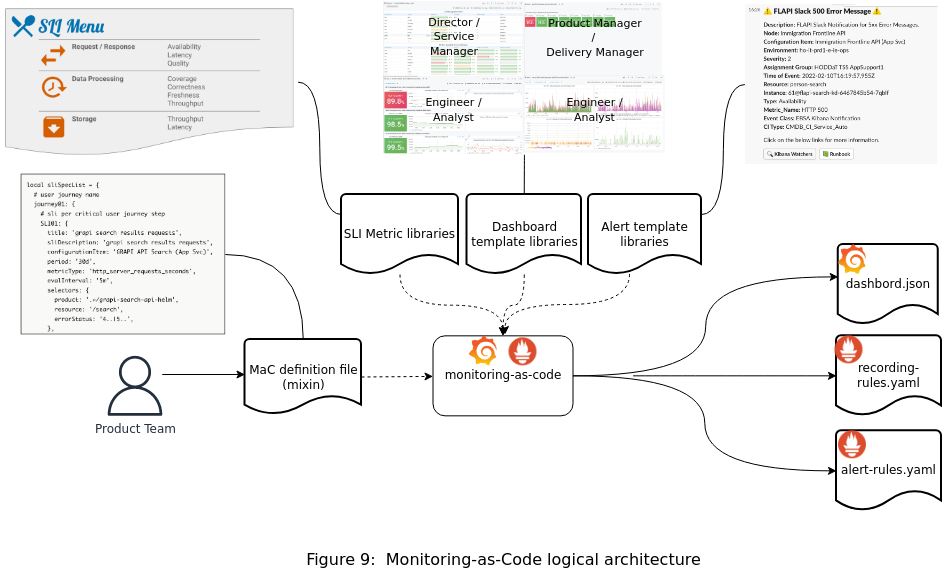
Logical Architecture
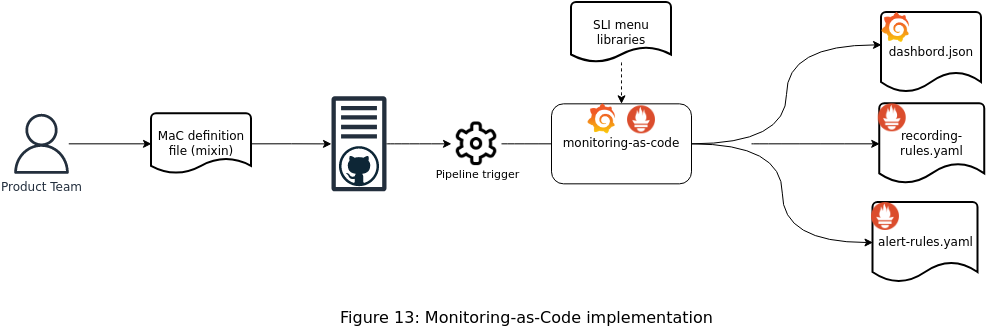
The MaC framework is invoked via a continuous integration pipeline and generates 3 artefacts: recording rules, alerting rules and dashboards.

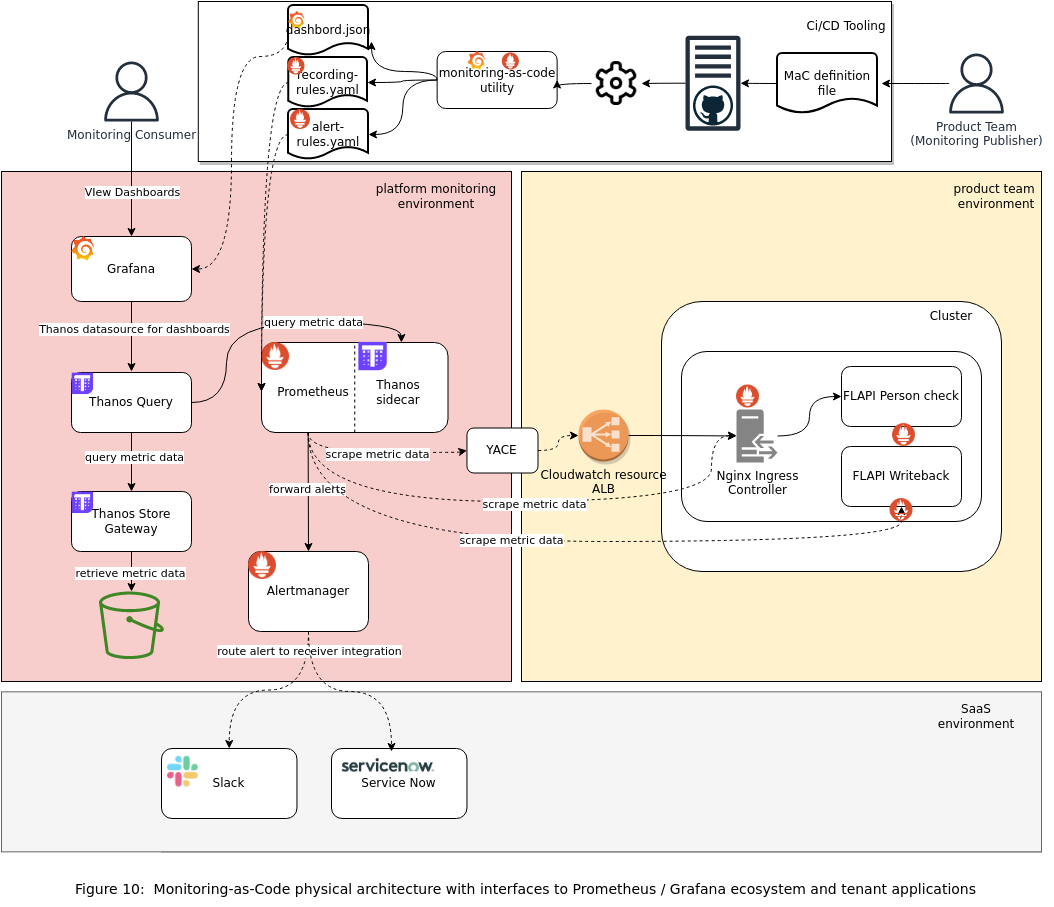
Physical Architecture
MaC artefacts are injected into Prometheus and Grafana instances at runtime using a number of distribution options.

Platform setup
The following platform setup is required to maximise the use of MaC:
-
Telemetry capture
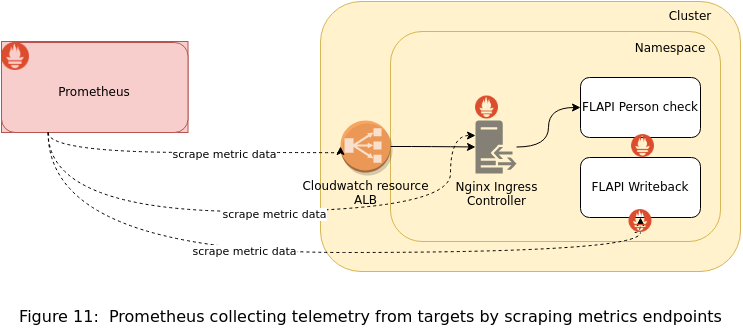
MaC is depending on Prometheus scraping the appropriate metrics from targets such as client instrumented apps, kubernetes controller/worker nodes and AWS CloudWatch namespaces.

-
Alertmanager and/or Incident Response Tool Configuration, Templating and Egress.
The appropriate recipients and templates should be configured on Alertmanager or Alert Management tooling such as Pager Duty/Ops Genie to ensure labels and annotations are propagated to ServiceNow for incident response.

-
Monitoring-as-Code adoption
MaC can be adopted by pulling the container from our GitHub Registry, setting up a mixin definition file and invoking manually through a shell script or via a pipeline using a Docker run command.

Monitoring & Alerting Specification
Prometheus/Grafana is used for metrics-based monitoring and a perfect candidate for generating SLIs based on a combination of different telemetry. It should be complimented by other tools providing synthetics and distributed tracing in a composite monitoring architecture.
| Category | Use | Tooling | Observability Pillar | MaC Coverage |
|---|---|---|---|---|
| Application performance monitoring | Investigate the behaviour of your application at the service level. Determine where calls are going and how they perform. | Prometheus/Grafana | Metrics | ✅ |
| Infrastructure Monitoring | Determine the health and performance of the containers, environment and managed services your applications run on. In AWS CloudWatch namespace provide | Prometheus/Grafana (via AWS CloudWatch scrape) | Metrics | ✅ |
| Real user monitoring | Understand the experience of real users by collecting data from browsers about how your site performs and looks. | Dynatrace RUM | Traces | ❌ |
| Synthetic monitoring | Allows you to test and measure the experience of your web application by simulating traffic with set test variables. | Dynatrace Synthetics / Pingdom | Metrics | ❌ |
| Alerting | Handles alerts sent by client applications, deduplicating, grouping, and routing them to the correct receiver integration. | Prometheus Alertmanager | Metrics | ✅ |
| Log Capture, Aggregation, Viewer | Aggregate, manage and analyse logs generated from your application and infrastructure. Troubleshoot the why behind what. | Elasticsearch (ELK) / Splunk | Logs | ❌ |
| Incident Response / Ticketing | IT Service Management tooling for Incident, Problem and Change Management | ServiceNow | Metrics | ✅ |
Non-functional Requirements
Alerting
Operational Dashboard Design
See dashboard design documentation
Operational Procedures/Work instructions
See runbook for responding to alerts
Release Management Process
This monitoring framework does not get deployed into an environment but is instead executed from within a pipeline. MaC automation pipelines are detailed in the contribution guide.
Accessibility
N/A at the moment as we are utilising Grafana out of box dashboards, however we will periodically review this to see once Grafana provides updates that provides enhancement accessibility features.
Recovery process
N/A - This is a metric based monitoring tool which utilises existing Prometheus and Grafana products. This means no additional policy/process are required - following existing practices.
Transaction Tracing
N/A - as this is a metric based monitoring tool which utilises existing Prometheus and Grafana products. This means no additional policy/process are required - following existing practices.
Application Logging & Log Aggregation specification
N/A - as this is a metric based monitoring tool which utilises existing Prometheus and Grafana products. This means no additional policy/process are required - following existing practices.
Backup Policies
N/A - as this is a metric based monitoring tool which utilises existing Prometheus and Grafana products. This means no additional policy/process are required - following existing practices.
Audit Event log
N/A - as this is a metric based monitoring tool which utilises existing Prometheus and Grafana products. This means no additional policy/process are required - following existing practices.
Operational Procedures/Work instructions - Release
N/A - as this is a metric based monitoring tool which utilises existing Prometheus and Grafana products. This means no additional policy/process are required - following existing practices.
Archive/Purge & Housekeeping Specification
N/A - as this is a metric based monitoring tool which utilises existing Prometheus and Grafana products. This means no additional policy/process are required - following existing practices.
Failure scenarios and error recovery work instructions
N/A - as this is a metric based monitoring tool which utilises existing Prometheus and Grafana products. This means no additional policy/process are required - following existing practices.
Confirm any new passwords, keys, certificates (and expiry) are handed to Live Service
N/A - as this is a metric based monitoring tool which utilises existing Prometheus and Grafana products. This means no additional policy/process are required - following existing practices.
Review Support & Licensing
N/A - as this is a metric based monitoring tool which utilises existing Prometheus and Grafana products. This means no additional policy/process are required - following existing practices.
Role Based Access Control (RBAC)
N/A - as this is a metric based monitoring tool which utilises existing Prometheus and Grafana products. This means no additional policy/process are required - following existing practices.
Confirmation of Encryption and Security Measures
N/A - as this is a metric based monitoring tool which utilises existing Prometheus and Grafana products. This means no additional policy/process are required - following existing practices.